Solve the problem.Suppose that during a certain step in a chemical manufacturing process the amount of hydrogen sulfide dissolved in a solution, measured in parts per million (ppm), is related to the elapsed time measured from the beginning of the step. Use the following table as a representation of this relationship. Represent the data in the table graphically with elapsed time on the horizontal axis and the amount of dissolved hydrogen sulfide on the vertical axis. What general trend do the data reflect?
A. With increasing elapsed time, the amount
of dissolved hydrogen sulfide increases.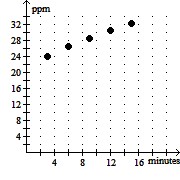
B. With increasing elapsed time, the amount
of dissolved hydrogen sulfide increases.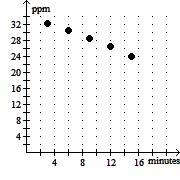
C. There is no apparent trend in the data.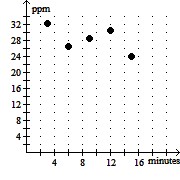
D. With increasing elapsed time, the amount
of dissolved hydrogen sulfide decreases.
Answer: A
You might also like to view...
Find the property tax. Round to the nearest cent.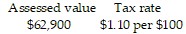
A. $5718.18 B. $69.19 C. $691.90 D. $57,181.82
Find absolute maximum and minimum values of the function, if they exist, over the indicated interval. Where no interval is specified, use the real line. List your answers in terms of ordered pairs.
f (x) = ?4x2 + 5x ? 3
Solve the system of equations by the addition method.
A. ( , -
, -  )
)
B. (5, 3)
C. (5, 15)
D. no solution
Solve the inequality. Give the solution set in both interval and graph forms.0 < 5x ? 20 ![]()
A. (0, 4)![]()
B. [0, 4)![]()
C. [0, 4]![]()
D. (0, 4]![]()