The graph of a function f is given. On the same axes, sketch the graph of f-1. 
A. 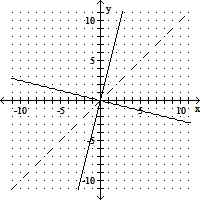
B. 
Answer: B
You might also like to view...
Sketch the graph of the equation. Identify the vertex and the intercepts.y = 2x2 + 3x - 2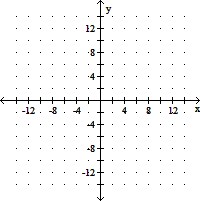
A. Vertex:  ;
;
x-intercepts: (-2, 0) and  ;
;
y-intercept: (0, 2)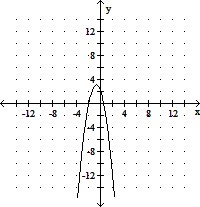
B. Vertex:  ;
;
x-intercepts: (2, 0) and  ;
;
y-intercept: (0, -2)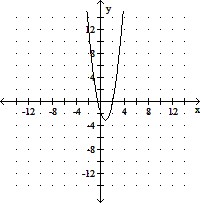
C. Vertex:  ;
;
x-intercepts: (-2, 0) and (1, 0);
y-intercept: (0, -2)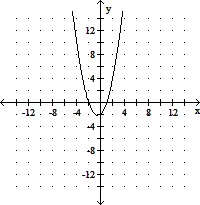
D. Vertex:  ;
;
x-intercepts: (-2, 0) and  ;
;
y-intercept: (0, -2)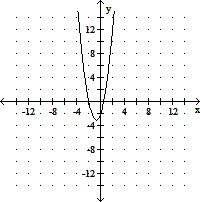
Plot the set of numbers on a number line.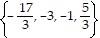
![]()
A. ![]()
B. ![]()
C. ![]()
D. ![]()
Graph the fraction on a number line.
![]()
A. ![]()
B. ![]()
C. ![]()
D. ![]()
Solve the problem.The following table shows the market prices per pound that a trucker can get for his load of fruit in three cities: San Francisco (S.F.), Las Vegas (L.V.), and Los Angeles (L.A).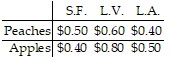 The trucker has a load of 3000 pounds of peaches and 3000 pounds of apples. Write the information from the table as a 2 x 3 matrix B. Write a row matrix A for which the entries represent the number of pounds of each type of fruit in the truck. If
  , find c12. What does this entry of C represent?
A. c12 = 4200. c12 represents the total value of the load in San Francisco. B. c12 = 4200. c12 represents the total value of the load in Las Vegas. C. c12 = 2050. c12 represents the total value of the load in Las Vegas. D. c12 = 2400. c12 represents the total value of the load in Las Vegas.