Use the circle graph to solve the problem. Give your answer as a fraction, decimal, and as a percent.The circle graph below shows the majors for 160 college students at Blackwood Community College. What portion of the students are majoring in science?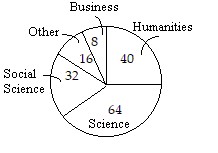
A.
 ; 0.4; 40% ; 0.4; 40% |
B.
 ; 0.4; 4%
C.
 ; 0.33; 33%
D.
 ; 0.2; 20% ; 0.2; 20% |
Answer: A
You might also like to view...
Simplify the exponential expression.
A. 9x23
B. 
C. 
D. 9x3
Find all numbers a such that the given point is on the circle x2 + y2 = 1.
A. a = ±
B. a = ±
C. a = ±
D. a = ±
Solve.The table below shows the population of four states in selected years. Population of Four States from 1960 to 2000 Source: US Census Bureau? 1960 1970 1980 1990 2000 Illinois 10,081,158 11,110,285 11,427,409 11,430,602 12,051,683 Michigan 7,823,194 8,881,826 9,262,044 9,295,297 9,679,052 Indiana 4,662,498 5,195,392 5,490,212 5,544,159 6,045,521 Minnesota 3,413,864 3,806,103 4,075,970 4,375,099 4,830,784How much did the population of Indiana increase from 1970 to 1990?
A. 881,661 B. 358,767 C. 348,767 D. 871,661
Use the Venn diagram below to determine the probability.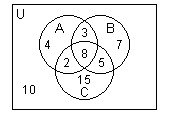 P(A)
P(A)
A. 
B. 
C. 
D. 