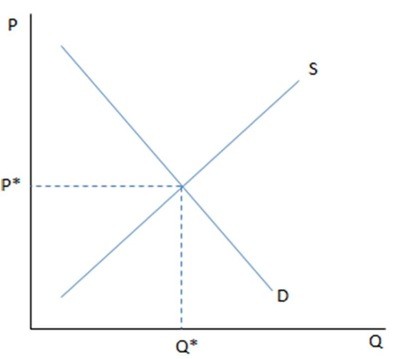
 If the graph shown is displaying a competitive labor market:
A. P* would represent how many people are employed in the market.
B. Q* would represent the equilibrium wage.
C. D would represent the workers' demand for jobs at each wage.
D. Q* would represent the equilibrium number of workers in the market.
Answer: D
You might also like to view...
An increase in the U.S. trade deficit could be caused by
A. The imposition of a tariff on imported goods. B. An appreciation of the dollar. C. An increase in the rate of inflation in other countries. D. A depreciation of the dollar.
Over the past two decades, the United States has
A. generally had, or been very near to a trade balance. B. had trade deficits in about as many years as it has trade surpluses. C. persistently had a trade deficit. D. persistently had a trade surplus.
In events leading to the housing bubble, the credit-rating agencies rated the assets associated with the housing market proper:
A. AAA ratings indicating low risk, and turned out to be too optimistic. B. AAA ratings indicating low risk, but turned out to be a right judgment. C. mid-level ratings indicating moderate risk, but were ignored. D. mid-level ratings indicating moderate risk, and turned out to be too pessimistic.
The return to a factor that is in fixed supply is a pure rent.
Answer the following statement true (T) or false (F)