Refer to the supply and demand graph below. S1 and D1 represent the current market supply and demand, respectively. S2 and D2 represent the socially optimal supply and demand. One way that the government could shift demand to its socially optimal level
is to:
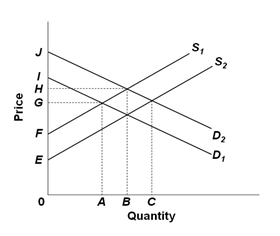
A. Tax the sellers
B. Tax the buyers
C. Subsidize the sellers
D. Subsidize the buyers
D. Subsidize the buyers
You might also like to view...
The goal of international economic policy cooperation is to allow for greater flexibility in exchange rates
Indicate whether the statement is true or false
Marginal utility is defined as the
a. average amount of satisfaction gained from consuming a product b. total amount of satisfaction gained from consuming a product c. additional satisfaction gained from consuming one more unit of a product d. total amount of satisfaction gained from consuming a product divided by the number of units consumed e. total amount of satisfaction gained from consuming a product times the number of units consumed
The tool most frequently relied on by the Fed is
a. interest rate changes. b. changing the money multiplier. c. changing the discount rate. d. open market operations. e. changing the reserve ratio.
A medium of exchange is
A) anything that is generally accepted in exchange for goods and services. B) a common measurement in which relative values are expressed. C) an item's ability to hold value over time. D) the exchange of goods and services for other goods and services. E) both a and d