Graph the function f(x) over the given interval. Partition the interval into 4 subintervals of equal length. Then add to your sketch the rectangles associated with the Riemann sum  , using the indicated point in the kth subinterval for ck.f(x) = x2 - 1, [0, 8], left-hand endpoint
A. 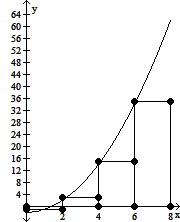
B. 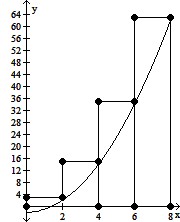
C. 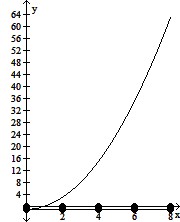
D. 
Answer: A
Mathematics
You might also like to view...
Find the polar coordinates,  and
and  , of the point given in Cartesian coordinates.(-
 , -
, - )
)
A. 
B. 
C. 
D. 
Mathematics
Graph the equation by plotting points.y = 
A. 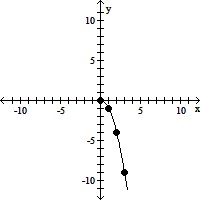
B. 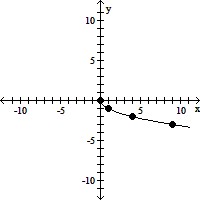
C. 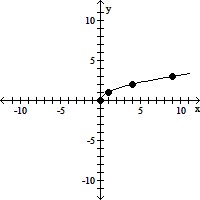
D. 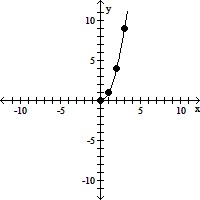
Mathematics
Use Bayes' rule to find the indicated probability.Two stores sell a certain MP3 players. Store A has 34% of the sales, 5% of which are of defective items, and store B has 66% of the sales, 1% of which are of defective items. The difference in defective rates is due to different levels of pre-sale checking of the product. A person receives a defective item of this product as a gift. What is the probability it came from store B?
A. 0.275 B. 0.22 C. 0.5667 D. 0.7083
Mathematics
Insert < or > to make the statement true.-9 _____ 9
A. -9 > 9 B. -9 < 9
Mathematics