Plot and interpret the appropriate scatter diagram.The table shows the study times and test scores for a number of students. Draw a scatter plot of score versus time treating time as the independent variable. 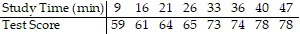
What will be an ideal response?
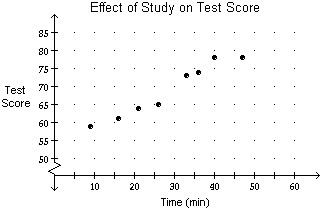
More time spent studying may increase test scores.
Mathematics
You might also like to view...
Solve the problem.Using the numerals 0 through 9, how many 5-digit serial numbers can be made if the first digit must be 0 or 1 and numerals may be repeated?
A. 20,000 B. 100,000 C. 80 D. 13,122
Mathematics
Use transformations of f(x) =  or f(x) =
  to graph the rational function.h(x) =
A. 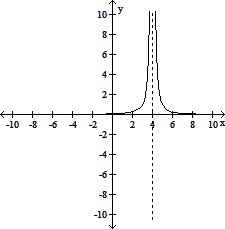
B. 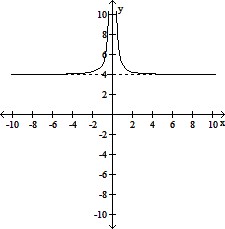
C. 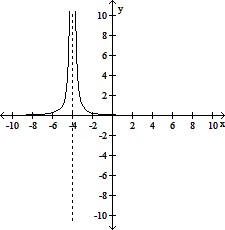
D. 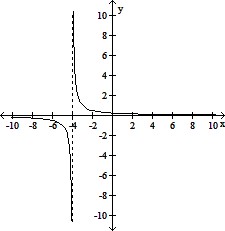
Mathematics
Simplify.2 ? 6 + 4(9 - 4) + 5
A. 105 B. 49 C. 52 D. 37
Mathematics
Let p represent "I eat too much," let q represent "I exercise," and let r represent "the food is good." Write the compound statement in symbols.If the food is not good, then I don't eat too much.
A. ~p ? ~r B. r ? ~p C. ~(r ? p) D. ~r ? ~p
Mathematics