The graph below represents the market for lychee nuts. The equilibrium price is $7.00 per bushel, but the market price is $5.00 per bushel
Identify the areas representing consumer surplus, producer surplus, and deadweight loss at the equilibrium price of $7.00 and at the market price of $5.00.
At the equilibrium price of $7.00:
Consumer surplus is represented by area A + B.
Producer surplus is represented by area C + D + E.
There is no deadweight loss.
At the market price of $5.00:
Consumer surplus is represented by area A + C.
Producer surplus is represented by area E.
Deadweight loss is represented by area B + D.
You might also like to view...
Briefly describe the following types of financial intermediaries:
1. Commercial bank 2. Investment bank 3. Mutual fund 4. Hedge fund 5. Pension fund 6. Insurance company
The economy is in long-run equilibrium when there is a correctly anticipated increase in aggregate demand. According to new classical theory, the price level will __________ and Real GDP will __________
A) fall; rise B) rise; fall C) fall; remain unchanged D) rise; remain unchanged E) remain unchanged; remain unchanged
The table shows items and figures taken from a consolidated balance sheet of the 12 Federal Reserve Banks. All figures are in billions of dollars. In this balance sheet, the assets would be items 5 and
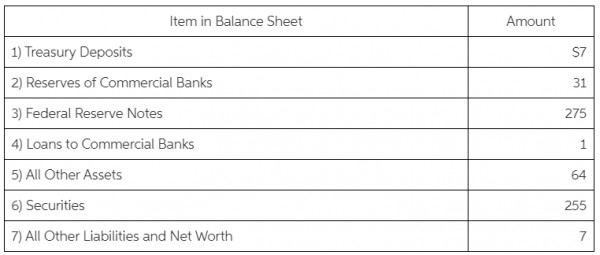
A. 4 and 6.
B. 2 and 3.
C. 1 and 2.
D. 3 and 4.
Pair-wise majority voting ________ the criteria of an ideal voting system.
A. meets all of B. fails to meet all of C. fails to meet one of D. fails to meet two of