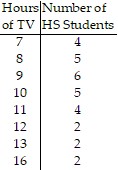
Use the data to construct a frequency distribution.A random sample of 30 high school students is selected. Each student is asked how much time he or she spent watching television during the previous week. The following times (in hours) are obtained: 8, 16, 10, 13, 10, 8, 10, 9, 7, 13, 11, 9, 9, 8, 11, 10, 7, 7, 12, 9, 7, 9, 16, 11, 8, 12, 8, 11, 10, 9Construct a frequency distribution for the data.
What will be an ideal response?
Mathematics
You might also like to view...
Decide if the statement is true or false.csc ? increases in value as ? goes from 0° to 90°.
A. False B. True
Mathematics
Find the derivative.y = 3 cos3(3x + 3)
A. -3 sin3(3x + 3) B. -81 sin2(3x + 3) C. 9 cos2(3x + 3) sin (3x + 3) D. -27 cos2(3x + 3) sin (3x + 3)
Mathematics
Solve the problem.Sue has taken four exams so far in her History course. His scores are 88.7, 78.2, 93, and 87.5. What is the average of these scores?
A. 87 B. 86.85 C. 85.45 D. 89.05
Mathematics
Use the Reduction Property to simplify the expression.
A. 
B. 
C. 
D. 
Mathematics