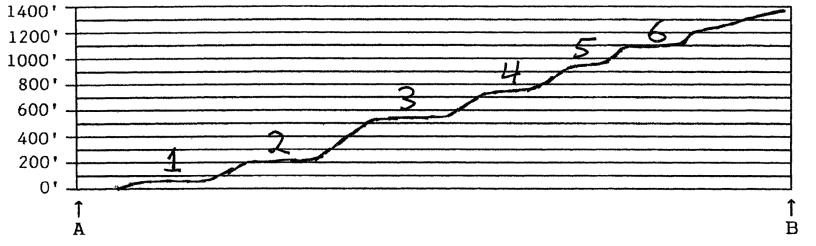
Using the graph below, construct a topographic profile from Point A to Point B. Plot index contours, and any intermediate contours necessary to accurately show significant changes in topography. The vertical exaggeration of the profile is 2x. The stereogram may be helpful in recognizing the extent of some terrace levels.
The following questions are based on Figure 49-8, a portion of the “San Clemente Island Central, California” quadrangle shown on the following page (scale 1:24,000; contour interval 25 feet; index contours drawn every fourth line; to view this map in color, go to the Lab Manual website or scan the QR code for this exercise), and the stereogram of San Clemente Island (Figure 49-7). The map and stereogram show a series of marine terraces on San Clemente Island in southern California (32°51"08"N, 118°29'58"W). The terraces have been incised by streams in several places.
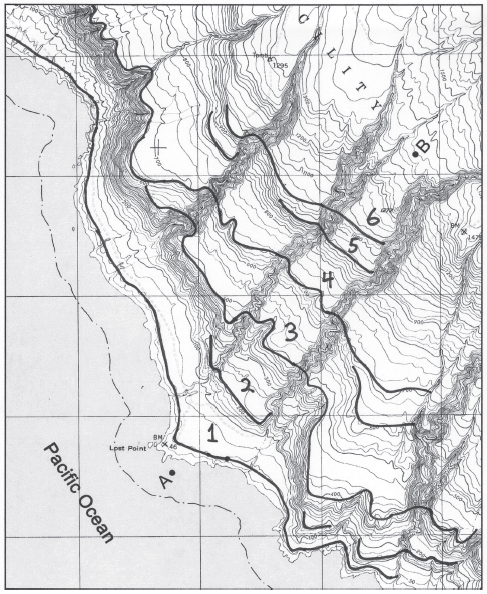
Figure 49-8: USGS “San Clemente Island Central, California” quadrangle (scale 1:24,000; contour interval 25 feet; note that the index contours on this map have been drawn every fourth line;cN)
You might also like to view...
Which North American region is complex, and is made up of drowned river valleys, bays, swamps, and low barrier islands?
A) the Ozark Plateau B) the West C) the Atlantic coastline D) the Appalachian Highlands E) the Great Plains
1:24,000 is an example of what kind of scale?
A) bar line B) metric scale C) graphic scale D) written scale E) fractional scale
What is density dependence?
What will be an ideal response?
Which group of marine algae is the most productive?
a) red algae b) diatoms c) green algae d) brown algae e) coccolithophores