The graph below shows the number of students enrolled in various courses at State University in spring 2000. Each bar represents a different course, and the height of the bar represents the number of students enrolled. Use the graph to answer the question.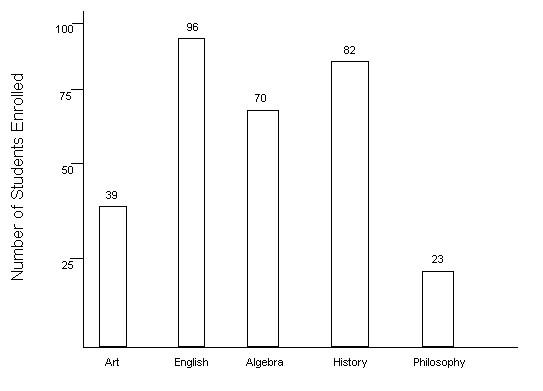 Write an inequality statement using < or > comparing the number of students enrolled in Algebra and History.
A. 70 ? 82
B. 70 < 82
C. 70 ? 82
D. 70 > 82
Answer: B
Mathematics
You might also like to view...
The figure shows the velocity v or position s of a body moving along a coordinate line as a function of time t . Use the figure to answer the question. v (ft/sec)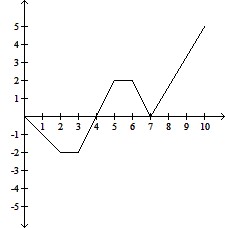
 When does the body reverse direction?
A. t = 4 sec B. t = 2, t = 3, t = 5, t = 6, t = 7 sec C. t = 7 sec D. t = 4, t = 7 sec
Mathematics
Provide an appropriate response.Let h(x) =  . Find functions f and g such that h = f ? g.
What will be an ideal response?
Mathematics
Determine whether or not the function is one-to-one.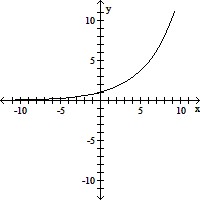
A. No B. Yes
Mathematics
Find the midpoint of the line segment joining the points P1 and P2.P1 = (b, 6); P2 = (0, 2)
A. 
B. 
C. 
D. 
Mathematics