Solve the problem.The following scatter diagram shows heights (in inches) of children and their ages.Height (inches)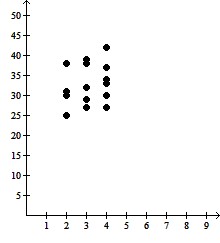 Age (years)What is the expected height range for a 2-year old child?
A. 25-38 inches
B. 40-50 inches
C. 20-30 inches
D. 35-45 inches
Answer: A
You might also like to view...
Which number is smaller than ?
A.
?
B.
?
C.
?
D.
?
E.
?
Find the Taylor series generated by f at x = a.f(x) = x3 + 5x2 - 2x - 2, a = -4
A. (x + 4)3 + 7(x + 4)2 + 6(x + 4) - 22 B. (x + 4)3 - 7(x + 4)2 + 10(x + 4) + 22 C. (x + 4)3 + 7(x + 4)2 + 10(x + 4) - 22 D. (x + 4)3 - 7(x + 4)2 + 6(x + 4) + 22
Solve.Under ideal conditions, a population of rabbits has an exponential growth rate of 11.7% per day. Consider an initial population of 200 rabbits. Find the exponential growth function.
A. P(t) = 200e0.117t B. P(t) = 20e0.117t C. P(t) = 100e11.7t D. P(t) = 100e1.17t
Set the viewing rectangle of your graphing calculator to  by
by  to solve the problem.Graph the following set of parametric equations for 0 ? t ? 2? and identify the letter of the alphabet that the graph resembles.x1 = -2 - 1.2 sin(0.7t),y1 = 3 - 1.2 cos(0.7t)x2 = -2 + 1.2 sin(0.7t),y2 = 0.6 + 1.2 cos(0.7t)
A. C B. O C. S D. U