Plot a scatter diagram.Draw a scatter diagram of the given data. Find the equation of the line containing the points (1, 1.4) and  Graph the line on the scatter diagram.
A. y = 0.3x + 1.1
B. y = 0.36x + 1
C. y = 0.39x + 1.04
D. y = 0.36x + 1.04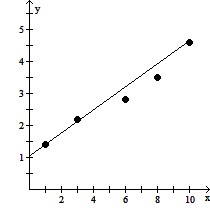
Answer: D
You might also like to view...
Solve the problem.A deep sea diving bell is being lowered at a constant rate. After 12 minutes, the bell is at a depth of 400 feet. After 50 minutes the bell is at a depth of 1400 feet. What is the average rate of lowering per minute?
A. 28.0 ft per minute B. 26.3 ft per minute C. 20.0 ft per minute D. 0.04 ft per minute
Simplify. Assume all variables and radicands represent nonnegative real numbers.5t -
- 
A. 27
B. 13t
C. 13t2
D. -3t
Solve the application involving the slope of a line.Recently, a stock split and the value per share increased. The stock was valued at $11 per share 3 days after the stock split and at $35 per share 11 days after the split. The equation  models the relationship between the stock's value, V , in dollars, and the number of days, t , since the stock split. Find the slope and give its meaning.
A. m = -3; During this period, the value of the stock decreased at the rate of $3 per day. B. m = 2; During this period, the value of the stock increased at the rate of $2 per day. C. m = 3; During this period, the value of the stock increased at the rate of $3 per day. D. m = -2; During this period, the value of the stock decreased at the rate of $2 per day.
Find the present value. Round to the nearest cent.To get $10,000 after 2 years at 9% compounded monthly
A. $10,938.07 B. $8358.31 C. $5000.00 D. $9142.38