Figure 6-7
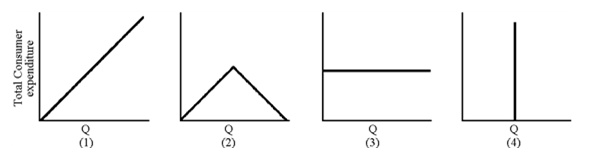
In Figure 6-7, which total expenditure curve belongs to a demand curve that is unit elastic throughout?
A. 1
B. 2
C. 3
D. 4
Answer: C
You might also like to view...
Refer to Figure 13-16. Figure 13-16 depicts a monopolistically competitive barber shop. Use the diagram to answer the following questions
a. Suppose the average variable cost of production is $15 when output equals 110 haircuts and $15.25 when output equals 140 haircuts. If the firm wants to maximize its profit or minimize its losses, how many haircuts will it produce and what price should it charge? Explain your answer. b. Calculate the firm's profit or loss. c. What is likely to happen in this industry over time as it moves to its new long-run equilibrium? d. Suppose the barber shop depicted in the diagram remains in the industry. Is this barber shop likely to produce this same quantity of haircuts as in part (a) in the long run?
Which of the following exchange rate policies was undertaken by the Chinese government in 1994?
A. A free-floating exchange rate regime was adopted. B. The Chinese yuan was revalued against the U.S. dollar. C. The Chinese yuan was revalued against the euro. D. The Chinese yuan was pegged to the U.S. dollar.
Sulfur Dioxide Discharged (Tons)Firm AFirm B10$8,000$9,000910,00012,000815,00018,000720,00027,000628,00037,000Table 16.3Table 16.3 shows the production cost for two utilities at different levels of sulfur dioxide emissions. Assume that the government issued 8 marketable pollution permits to each firm. If the two firms agree to swap one permit and split the difference between the willingness to pay and willingness to accept, what is the price of a permit?
A. $4,500 B. $5,500 C. $7,250 D. $9,750
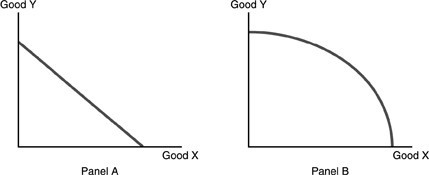 Refer to the above figure. Which of the following statements is TRUE?
A. Panel A represents an economy that has a lower level of technology than Panel B. B. In Panel A, equal amounts of Y must be given up to obtain equal increments of X while in Panel B increasingly greater amounts of Y must be given up to obtain equal increments of X. C. Opportunity costs do not apply to Panel A but apply to Panel B. D. Panel A does not represent an economy that is producing efficiently while Panel B does.