The graph shown demonstrates a tax on sellers. Who bears the greater tax incidence?
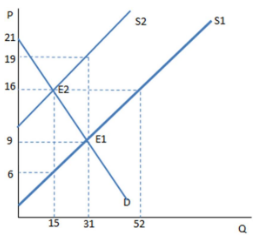
A. The sellers
B. The buyers
C. The government
D. The incidence is equally shared between buyer and seller.
B. The buyers
You might also like to view...
Economic surplus is maximized in a competitive market when
A) producers sell the quantity that consumers are willing to buy. B) demand is equal to supply. C) marginal benefit equals marginal cost. D) the deadweight loss equals the sum of consumer surplus and producer surplus.
The production possibilities curve represents
A) the total amount of stocks and bonds that exist in the economy. B) the trade-off between human capital and physical capital that exists. C) all possible combinations of total output that can be produced. D) society's needs.
Which of the following is most likely to cause the savings supply curve in the market for loanable funds to shift leftward?
A) Government borrows to finance a war. B) All firms project higher future revenue streams for all of their projects. C) All firms project lower future revenue streams for all of their projects. D) Government institutes a high tax on savings.
Assuming that inflation has occurred over time, what is the relationship between nominal GDP and real GDP in each of the following situations In years prior to the base year, nominal GDP _____ real GDP
Fill in the blank(s) with the appropriate word(s).