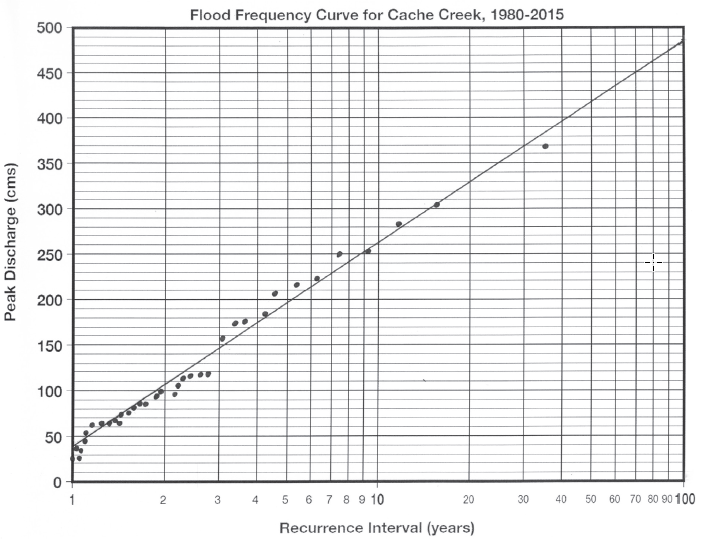
Determine the Flood Frequency Curve for Cache Creek by plotting the “Recurrence Interval” against “Peak Discharge” on the chart below (note that the Recurrence Interval scale is logarithmic). (Hint: Your plot of data points should form a nearly straight line, so first plot the three largest floods, and then the three smallest—the rest of your points will line up along this trend.) Using a ruler, draw a straight line through the center of your plot, trying to have as many data points below the line as above.
What will be an ideal response?

You might also like to view...
How many valence electrons does bromine (Br, atomic no. = 35) have?
A. 28 B. 1 C. 35 D. 21 E. 7
Why is older climate data smoother when graphed than the present spikiness?
A) Climate was unusually steady millions of years ago. B) Each data point represents less years in the older data. C) Each data point represents more years in the older data. D) Both A and C
Mafic magma at a temperature of 1200°C intrudes into felsic continental-crust rocks 15 km below the surface. Will the granite melt? If so, what will happen to the resulting magma? Use information presented in the chapter to support your answer
What will be an ideal response?
A ________ is a naturally occurring solid chemical element or inorganic compound with a distinct composition and a crystal structure
A) nutrient B) rock C) sediment D) horizon E) mineral