Exhibit 1 shows which of the following trends?

a. As the price of coffee decreases, Elizabeth demands less coffee.
b. As the price of coffee increases, Elizabeth demands less coffee.
c. As the price of coffee decreases, Elizabeth at first demands more coffee, but then demands less.
d. As the price of coffee increases, Elizabeth at first demands more coffee, but then demands less.
b. As the price of coffee increases, Elizabeth demands less coffee.
You might also like to view...
When real planned saving is greater than real planned investment spending
A) real GDP will increase. B) the interest rate will increase. C) the interest rate will decrease. D) real GDP will decrease.
Because leisure is a normal good, an increase in the wage rate will result in
A) an increase in the quantity of labor supplied because of the substitution effect. At low wages the income effect causes an increase in the quantity of labor supplied, but at high wages the income effect causes a decrease in the quantity of labor supplied as the wage rises. B) an increase in the quantity of labor supplied because of both the substitution effect and the income effect. C) a decrease in the quantity of labor supplied because of the substitution effect and an increase in the quantity of labor supplied because of the income effect. D) an increase in the quantity of labor supplied because of the substitution effect and a decrease in the quantity of labor supplied because of the income effect.
Refer to the graph shown. What price represents the shutdown price?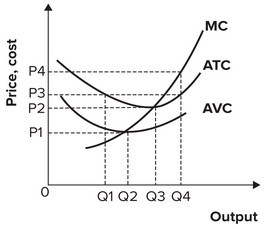
A. P1 B. P2 C. P3 D. P4
The ________ shows the relationship between the price level and quantity of real GDP demanded
A) consumer price index B) aggregate expenditure line C) 45-degree line D) aggregate demand curve