Solve the problem.The graph depicts a relationship between scores achieved on an unspecified standardized test and family income. Find the slope of the line.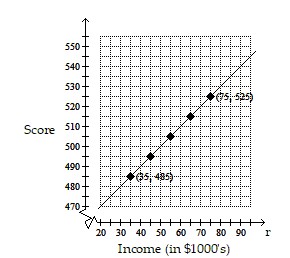
A. 1 point(s) per thousand dollars
B. 10.1 points per thousand dollars
C. 1000 points per thousand dollars
D. 100 points per thousand dollars
Answer: A
You might also like to view...
Provide an appropriate response.Find 8.5% of 0.3.
A. 0.255 B. 0.0255 C. 0.353 D. 3.529
Use the theoretical probability formula to solve the problem. Express the probability as a fraction reduced to lowest terms.Use the spinner below to answer the question. Assume that it is equally probable that the pointer will land on any one of the five numbered spaces. If the pointer lands on a borderline, spin again. Find the probability that the arrow will land on an odd number. 
A. 0
B. 
C. 1
D. 
Divide. Write the answer as a mixed number as needed.9 ÷ 5
÷ 5
A. 9
B. 45
C. 1
D. 1
If a system of two linear equations has no solution, then the lines representing those two equations _________________.
What will be an ideal response?