This graph demonstrates the domestic demand and supply for a good, as well as a tariff and the world price for that good.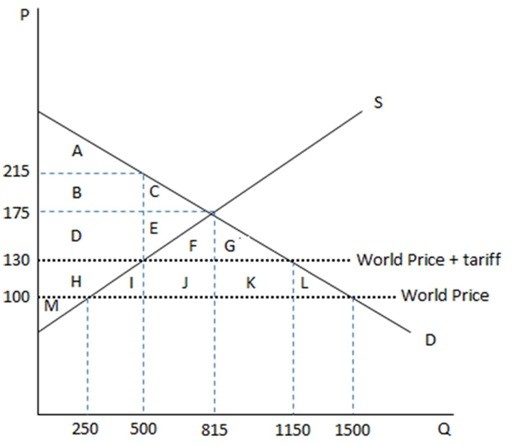 According to the graph shown, if the economy decides to impose a tariff, the government can expect to raise how much in government revenues?
A. $37,500.
B. $19,500.
C. $27,000.
D. $34,500.
Answer: B
You might also like to view...
What is an opportunity cost?
What will be an ideal response?
The figure above shows supply curves for soft drinks. Suppose the economy is at point a. A movement to point d would be the result of
A) an increase in technology. B) a decrease in the relative price of a soft drink. C) an increase in the relative price of a soft drink. D) an increase in the number of soft drink suppliers.
Explain how the concept of externalities helps in demarcating the boundaries between the roles of government and private sector in health and health care
What will be an ideal response?
The fact that banks operate on a "sequential service constraint" means that
A) all depositors share equally in the bank's funds during a crisis. B) depositors arriving last are just as likely to receive their funds as those arriving first. C) depositors arriving first have the best chance of withdrawing their funds. D) banks randomly select the depositors who will receive all of their funds.