Use the line graph to answer the question.The line graph shows the 2001 sales data for the Big "D" company. 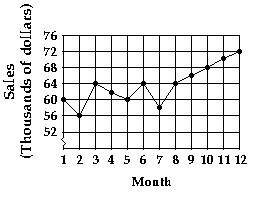 Find the increase in sales between month 8 to month 11.
A. $8000
B. $2000
C. $6000
D. $4000
Answer: C
You might also like to view...
Write an equation that models the described quantity. Specify what each variable represents.A barrel contains 300 gallons of water and is being filled at a rate of 2 gallons per minute.
A. t = 300g- 2, where g represents gallons of water and t represents time in minutes B. g = 2t - 300, where g represents gallons of water and t represents time in minutes C. t = 300g+ 2, where g represents gallons of water and t represents time in minutes D. g = 2t + 300, where g represents gallons of water and t represents time in minutes
Provide an appropriate response.A welder analyzed his account records and discovered that his profit could be predicted by the formula P = -x2 + 80x - 1,500, where x represents the number of welds he could do daily. What would be his daily profit?
Fill in the blank(s) with the appropriate word(s).
Write four additional terms of the geometric sequence.6, -18, 54, . . .
A. -162, -486, -1458, -4374 B. -162, 486, -1458, 4374 C. 162, -486, 1458, -4374 D. 162, 486, 1458, 4374
Evaluate.(10 - 5)!
A. 50 B. 120 C. 3,628,800 D. 24