Graph the inequality.x < 1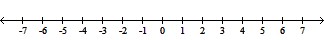
A. ![]()
B. ![]()
C. ![]()
D. ![]()
Answer: D
You might also like to view...
The average delay time D, in seconds, for a car waiting at a certain stop sign is given by
 ,
?
where q is the number of cars per second passing the stop sign.A: What is the average delay time if there are 0.13 cars per second passing the sign? Round your answer to two decimal places if necessary.B: The service rate S, for a stop sign is the number of cars per second that can leave the stop sign. It is related to the delay time by
,
?
where q is the number of cars per second passing the stop sign.A: What is the average delay time if there are 0.13 cars per second passing the sign? Round your answer to two decimal places if necessary.B: The service rate S, for a stop sign is the number of cars per second that can leave the stop sign. It is related to the delay time by
 .
Find a formula for S in terms of q.C: What flow rate will permit a service rate of 0.85 cars per second? Round your answer to two decimal places if necessary.
?
What will be an ideal response?
.
Find a formula for S in terms of q.C: What flow rate will permit a service rate of 0.85 cars per second? Round your answer to two decimal places if necessary.
?
What will be an ideal response?
Solve the formula for the specified letter. =
=  for P
for P
A. P = 
B. P = 
C. P = 
D. P = 
Graph the quadratic function using its vertex, axis of symmetry, and intercepts.f(x) = -x2 - 2x + 3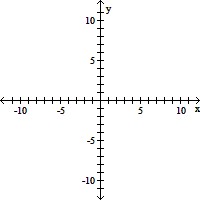
A. vertex (-1, -4)
intercepts (1, 0), (- 3, 0), (0, -3)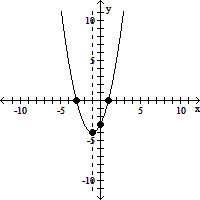
B. vertex (1, 4)
intercepts (-1, 0), (3, 0), (0, 3)
C. vertex (1, -4)
intercepts (-1, 0), (3, 0), (0, -3)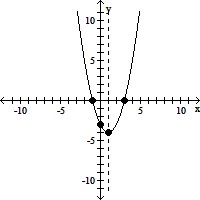
D. vertex (-1, 4)
intercepts (1, 0), (- 3, 0), (0, 3)
Is the given value a solution to the equation? y + 7 = 8; y = 5
A. Yes B. No