Plot and interpret the appropriate scatter diagram.The table shows the study times and test scores for a number of students. Draw a scatter plot of score versus time treating time as the independent variable. 
What will be an ideal response?
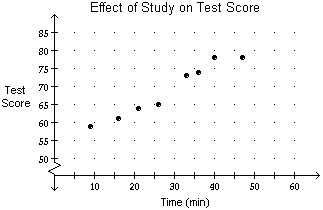
More time spent studying may increase test scores.
You might also like to view...
Identify the variable factors and indicate the degree.7m2n4
A. 7 ? m ? m ? n ? n ? n ? n; degree 8 B. m ? m ? n ? n ? n ? n; degree 6 C. m ? n; degree 6 D. m ? m ? n ? n ? n ? n; degree 7
Answer the question.How would you find the empirical probability of getting a red card, if you are choosing a card from an ordinary deck of 52 cards?
A. Choose a card from a deck of 52 cards 52 times and then find the relative frequency of red cards. This would be done by dividing the number of times a red card has occurred by 52. B. Choose a card from a deck of 52 cards 2 times and then find the relative frequency of red cards. This would be done by dividing the number of times a red card has occurred by 2. C. Choose a card from a deck of 52 cards many times and then find the relative frequency of red cards. This would be done by dividing the number of times a red card has occurred by the total number of times a card was chosen. D. The empirical probability cannot be determined.
Subtract.299 - 55
A. 344 B. 234 C. 244 D. 256
Divide. Simplify, if possible.  ÷
÷ 
A. - 1
B. 
C. - 1
D. - 