According to the graph shown, if this economy is an autarky, its equilibrium price is:
This graph demonstrates the domestic demand and supply for a good, as well as a tariff and the world price for that good.
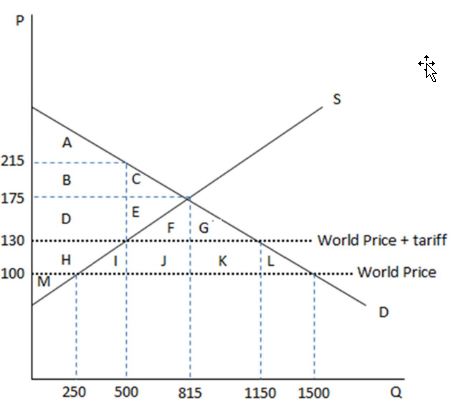
A. $175 at a quantity of 815.
B. $215 at a quantity of 500.
C. $130 at a quantity of 1150.
D. $130 at a quantity of 500.
A. $175 at a quantity of 815.
You might also like to view...
The short run is the time period during which a firm has at least one input constraint
Indicate whether the statement is true or false
At any point below the current LM curve there is an
A) excess demand for money. B) excess supply of money. C) excess demand for goods. D) excess supply of goods.
The notion of opportunity cost can be represented graphically by the
a. area inside the production possibilities frontier. b. slope of the production possibilities frontier. c. vertical distance from the horizontal axis to the production possibilities frontier. d. horizontal distance from the vertical axis to the production possibilities frontier. e. sum of the horizontal and vertical distances to the production possibilities frontier.
In a famous article published in 1958, A.W. Phillips used data for the United Kingdom to show a negative relationship between the rate of change of wages in the U.K. and the U.K. unemployment rate
a. True b. False Indicate whether the statement is true or false