A demand curve that shows the relationship between the price of a good and the amount of the good consumed holding the consumer's well-being fixed and allowing their to income vary is called:
A. an uncompensated demand curve.
B. a compensated demand curve.
C. a Marshallian demand curve.
D. a derived demand curve.
B. a compensated demand curve.
You might also like to view...
Which geographic coincidence affected gasoline prices the most during 2005?
A. A tsunami hit the one area in the world most responsible for producing U.S. gasoline, Indonesia. B. Two major hurricanes affected the refining intensive areas of New Orleans and Houston. C. An earthquake happened to hit the energy-sensitive areas in and around Iran. D. There were tornado related electrical outages in the industrial Midwest.
Use the graph below to answer the next question.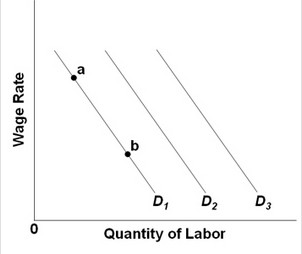 Other things equal, an increase in labor productivity would cause a
A. move from a to b on D1. B. move from b to a on D1. C. shift from D2 to D3. D. shift from D3 to D2.
In Figure 6-3(b), as price falls from $15 to $6, total expenditure
A. falls. B. increases. C. remains constant. D. first falls and then increases.
The struggle among various producers for the consumer's business called ____________ .
a. socialism b. competition c. incentive d. self-regulation