Refer to the data provided in Table 17.1 below to answer the following question(s). The table shows the relationship between income and utility for Jane.Table 17.1 IncomeTotal Utility $00$20,00025$40,00045$60,00060$80,00070Refer to Table 17.1. From the table, we can see that Jane is
A. risk-neutral.
B. risk-averse.
C. risk-loving.
D. We cannot determine Jane's attitude toward risk from the table.
Answer: B
You might also like to view...
During a recession, unemployment
a. increases b. decreases. c. is equal to the natural rate of unemployment. d. is frictional unemployment minus structural unemployment.
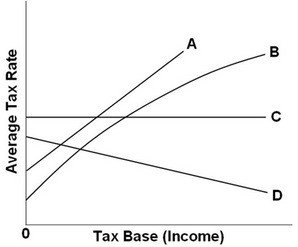 Refer to the above graph. Which of the lines in the above diagram represent(s) a progressive tax?
A. Both A and B B. B only C. C only D. D only
What is the importance of competition in relation to self-interest in a market system?
Please provide the best answer for the statement.
When the government provides a public good by taxing citizens and using tax money to provide the good:
A. the result is efficient if the total benefits of the public good is greater than the cost of providing it. B. the result is inefficient because the government is an inefficient provider of goods and services. C. the result is inefficient because if it were efficient the good would have been provided in a free market. D. the result is efficient only if voters specifically agreed to provision of that good.