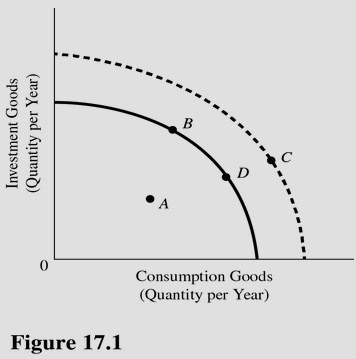
 Long-run economic growth can be illustrated in Figure 17.1 by a
A. Movement from point A to point B.
B. Shift outward of the production possibilities curve.
C. Movement from point D to point B.
D. Shift inward of the production possibilities curve.
Answer: B
You might also like to view...
Which of the following statements best describes the study of economics? Economics studies how
A) to organize production so that scarcity does not occur. B) firms make profits. C) we make choices in the face of scarcity. D) to create incentives so that scarcity does not exist. E) businesses reach decisions.
If the price level doubles, the value of money
A) doubles. B) more than doubles, due to scale economies. C) rises but does not double, due to diminishing returns. D) falls by 50 percent.
The Fed has which of the following as its strongest control over the money supply?
A. Interest rate changes B. The discount rate C. Open-market operations D. The required reserve rate
Refer to the diagram, which shows demand and supply conditions in the competitive market for product X. If the initial demand and supply curves are D 0 and S 0 , equilibrium price and quantity will be:
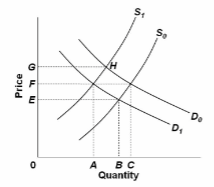
A. 0F and 0C, respectively.
B. 0G and 0B, respectively.
C. 0F and 0A, respectively.
D. 0E and 0B, respectively.