Refer to the information provided in Figure 5.7 below to answer the question(s) that follow.
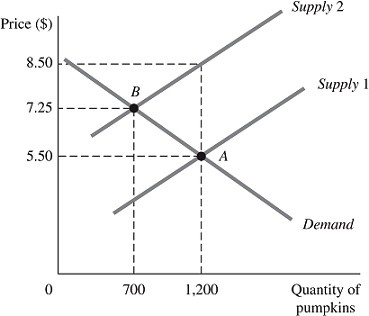 Figure 5.7The above figure represents the market for pumpkins both before and after the imposition of an excise tax, which is represented by the shift of the supply curve.Refer to Figure 5.7. Had the demand for pumpkins been perfectly inelastic at Point A, the amount store owners would have received per pumpkin after the imposition and payment of this tax would have been
A. $3.00.
B. $5.50.
C. $7.25.
D. $8.50.
Answer: B
You might also like to view...
Two heavy equipment manufacturers might collude in an effort to do all of the following except one. Which is the exception?
a. determine a more advantageous price and quantity b. prevent new entry into the market c. take advantage of the legal benefits that U.S. cartels receive d. increase their combined profits e. predict the behavior of other competitors in the heavy equipment market with greater certainty
Which of the following distinguishes industrially advanced countries from less-developed countries?
a. GDP per capita. b. Educational attainment of the workforce. c. Extent to which capital is technologically advanced. d. All of the above.
Suppose that the consumer price index of a country was 160 at year-end 2007 and 168 at the end of 2008 . What was the country's inflation rate during 2008?
a. 5 percent b. 8 percent c. 60 percent d. 68 percent
In order to promote growth, the poorest countries-in contrast to the middle-level and rich countries-need most to:
A. increase their capital stock. B. invest in human capital. C. improve their infrastructure. D. improve their legal and political environments.