Figure 18-1
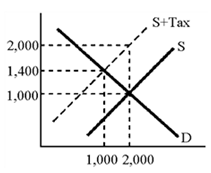
According to the graph in Figure 18-1, the tax is which of the following?
A. 400
B. 600
C. 1,000
D. 200
Answer: C
You might also like to view...
When interest rates are lower, consumers and companies are able to borrow money cheaply in order to make major purchases. As a result, the demand for goods in an economy will generally
A) remain the same. B) increase. C) decrease. D) be minimally affected.
Which group within the National Bureau of Economic Research officially determines whether the economy is in a recession or expansion?
A) The G-4 B) The Business Cycle Dating Committee C) The Business Cycle Governors D) The Turning Point Group
In a perfectly competitive market, the long-run industry supply curve is perfectly elastic at the minimum point of the ATC curve
a. True b. False Indicate whether the statement is true or false
The cost of group health insurance is lower than if an individual buys a policy on his own because
A) the problem of adverse selection is reduced. B) moral hazard costs of a group tend to move to a low average. C) it is easier for the company to deny claims from a large group. D) insuring a group eliminates the problem of buyers having more information than the seller.