Solve the problem.The table below gives the violent crime rate (per 100,000 people) for a particular state every five years from 1970 to 2010.  Use technology to find the cubic function that is the best fit for this data, where x is the number of years after 1970. Use the model to estimate the year having a violent crime rate of 11.4 per 100,000.
A. 2016
B. 2012
C. 2014
D. 2011
Answer: C
Mathematics
You might also like to view...
Indicate whether the statement is true always, sometimes, or never.The product of two imaginary numbers is a real number.
A. Always B. Sometimes C. Never
Mathematics
Graph the line having slope m and containing the given point. Do not find the equation of the line.m =  , (2, 4)
A. 
B. 
C. 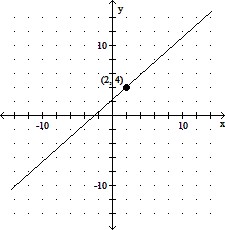
D. 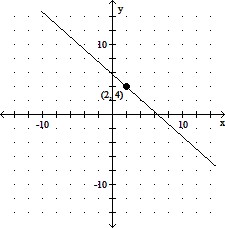
Mathematics
Find the exact function value.sec 45°
A. 1
B. 
C. 
D. 
Mathematics
Factor completely.x2 + 59x + 60
A. (x - 12)(x + 5) B. (x + 12)(x - 5) C. (x + 60)(x - 1) D. Prime
Mathematics