Using a graph, show a market equilibrium. Suppose the costs of inputs increase. How is this shown on the graph? Explain what is happening in the market
What will be an ideal response?
In the graph, the original equilibrium is at E, where the demand curve and the supply curve intersect. Price is P1 and quantity is Q1. The increase in costs of inputs causes the supply to decrease, shown by a shift of the supply curve to the left (S1). At price P1, there is an excess quantity demanded equal to Q1 - Q3. Price rises to P2, causing quantity demanded to decrease until the new equilibrium at E is reached. The new price is P2 and the new quantity is Q2.
You might also like to view...
If the Fed's goal is to keep the interest rate fixed, a contractionary fiscal policy must be accompanied by ________ monetary policy that shifts the LM curve to the ________
A) an expansionary, right B) an expansionary, left C) a contractionary, right D) a contractionary, left
If the price elasticity of supply of a good is elastic and the good price increases, then the increase in the good's supply should be
A) greater than the increase in price. B) less than the increase in price. C) the same as the increase in price. D) Cannot be determined from this information
According to the graph shown, if the economy is operating in autarky and decides to open trade with a tariff, the impact on domestic demand is they will:
This graph demonstrates the domestic demand and supply for a good, as well as a tariff and the world price for that good.
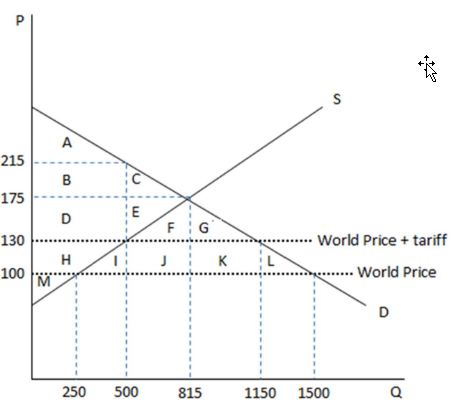
A. decrease consumption from 1500 to 1150.
B. increase consumption from 815 to 1500.
C. increase consumption from 815 to 1150.
D. decrease consumption from 1500 to 815.
An event that changes the supply of any factor of production can alter the earnings of all the factors
a. True b. False Indicate whether the statement is true or false