Based on the figure below. Starting from long-run equilibrium at point C, a tax cut that increases aggregate demand from AD to AD1 will lead to a short-run equilibrium at point ________ and eventually to a long-run equilibrium at point ________, if left to self-correcting tendencies. 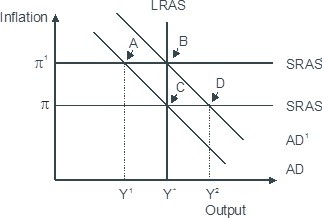
A. D; C
B. B; C
C. B; A
D. D; B
Answer: D
You might also like to view...
Exhibit 11-10 GDP data (billions of dollars) Indirect business taxes$ 600 Depreciation950 Change in business inventories50 Compensation of employees5,400 Corporate profits700 Durable goods600 Exports100 Social Security taxes360 Transfer payments300 Fixed investment950 Government spending800 Imports150 Net interest500 Nondurable goods2,000 Personal taxes1,000 Rental income200 Services4,000 In Exhibit 11-10, and using the expenditures approach, compute net exports (X-M). Which of the following is correct?
A. $500 billion. B. $150 billion. C. $100 billion. D. -$50 billion.
In the graph shown, the globally constrained potential output is: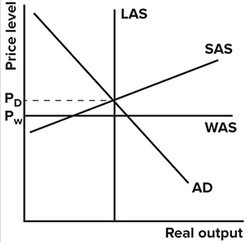
A. the LAS curve shown, but horizontal. B. the same as the LAS curve shown. C. to the left of the LAS curve shown. D. to the right of the LAS curve shown.
A Consumer Price Index (CPI) adjustment overcompensates for inflation because it ignores
A) the income effect when relative prices change. B) the substitution effect when relative prices change. C) that some goods are inferior. D) that the substitution effect may offset the income effect.
An increase in technology will cause a marginal revenue product of labor curve to
A. shift to the right. B. become more inelastic. C. be unaffected because the productivity of labor has not changed. D. shift to the left.