Based on the graph showing diminishing marginal utility of income, which action would cause the greatest loss in utility?
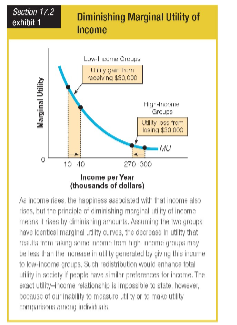
a. taking $30,000 from high earners
b. taking $30,000 from low earners
c. giving $30,000 to high earners
d. giving $30,000 to low earners
b. taking $30,000 from low earners
You might also like to view...
The productivity curve is a relationship between ________ and ________
A) real GDP per hour of labor; capital per hour of labor B) real GDP per hour of labor; capital C) capital per hour of labor; labor per hour of capital D) real GDP; hours of labor E) real GDP; capital
What are depository institutions?
What will be an ideal response?
Pizza and beer are complements. The price of beer increases. What happens to the market for pizza?
A. Equilibrium price falls; equilibrium quantity rises. B. Equilibrium price falls; equilibrium quantity falls. C. Equilibrium price rises; equilibrium quantity falls. D. Equilibrium price rises; equilibrium quantity rises.
The slope of the PPF can be expressed as:
a. the ratio of abundance of capital to labor. b. the preferences of consumers in terms of marginal utility. c. the ratio of the quantities of good 1 and good 2. d. the negative of the ratio of the marginal products of labor in producing each good