The table shows, for some particular year, a listing of several income levels and, for each level, the proportion of the population in the level and the probability that a person in that level bought a new car during the year. Given that one of the people who bought a new car during that year is randomly selected, find the probability that that person was in the indicated income category. Round your answer to the nearest hundredth. 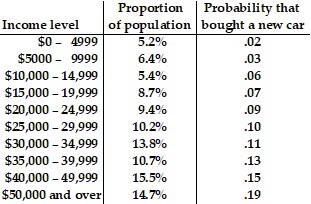 $35,000 - $39,999
A. .09
B. .11
C. .15
D. .13
Answer: D
Mathematics
You might also like to view...
Provide an appropriate response.Arrange the quadratic equation in standard form: 2x2 + 7 = 5x
A. 2x2 + 5x + 7 = 0 B. 2x2 - 5x = -7 C. 2x2 - 5x + 7 = 0 D. 2x2 - 5x - 7 = 0
Mathematics
Identify the polynomial as a monomial, binomial, trinomial, or none of these. Give its degree.-16x3 - 7w2 - 5w - 5y4 + 1
A. Trinomial, degree 4 B. None, degree 4 C. Binomial, degree 11 D. Trinomial, degree 10
Mathematics
Simplify the expression. Assume all variables represent positive real numbers. -
- 
A. -7
B. - 
C. - 
D. -3.5
Mathematics
Solve the equation.2 + log3(2x + 5) - log3 x = 4
A. 
B. 
C. 
D. 
Mathematics