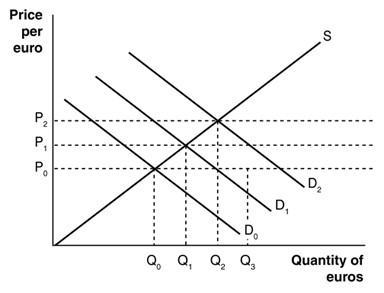
 In the above figure, suppose the value of the European euro is P1 and U.S. demand for French wine declines. The effect on the euro can be shown by
A. the decrease in the value of the euro to P0.
B. an increase in the value of the euro to P2.
C. a shift in the demand for euros from D1 to D0, but no change in the value of the euro.
D. the excess demand of euro equal to Q3 - Q1.
Answer: A
You might also like to view...
The proportion of the total population aged 0–15 and over 65, is known as the
(a) dependency burden. (b) unproductive population. (c) surplus labor. (d) population momentum.
The president of a large public university proclaims, "If we can get the state government to fund our new football stadium, it will not cost us anything." Evaluate this view from an economic perspective
If a firm increases the number of workers from 32 to 33 and the total wages paid rise from $112,000 to $121,000, the marginal wage of the 33rd worker is
A. $121,000. B. $9,000. C. $273. D. $3,667.
A monopolist would not be able to make a positive profit at any price output combination when
A) marginal cost is less than average total cost for one more unit of output. B) the average variable cost curve is everywhere above the marginal revenue curve. C) the minimum point of the average total cost curve lies to the right of the minimum of the average variable cost curve. D) the average total cost curve is everywhere above the demand curve.