Based on the graph above, a cause of movement from point 1 to point 2 might be ________
A) a positive price shock
B) government policy that lowers unemployment
C) an increase in potential output
D) an increase in expected inflation
E) none of the above
B
You might also like to view...
Once supply side effects are taken into account, tax cuts for labor income can change
i. the supply of labor. ii. potential GDP. iii. the growth rate of potential GDP. A) iii only B) ii only C) i only D) i and ii E) i and iii
The above figure shows Bobby's indifference map for juice and snacks. Also shown are three budget lines resulting from different prices for snacks. As the price of snacks rises, the price for juice
A) stays the same. B) increases. C) decreases D) might change, but there is not enough information to determine.
Refer to the information provided in Figure 2.5 below to answer the question(s) that follow.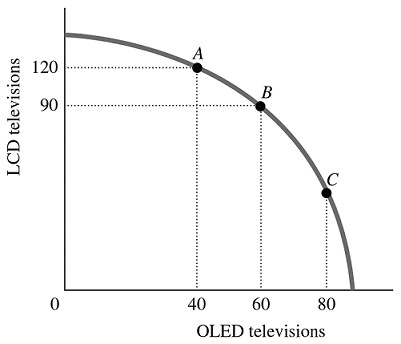 Figure 2.5Refer to Figure 2.5. The best point for society would be
A. either Point B or Point C, as the total amount being produced at either of these points is approximately the same. B. at any of the labeled points, as all of the points represent an efficient allocation of resources. C. Point C, as at this point there are approximately equal amounts of LCD and OLED televisions being produced. D. indeterminate from this information, as we don't have any information about the society's desires.
Refer to the figure. Assuming this market is representative of the economy as a whole, a positive demand shock will:
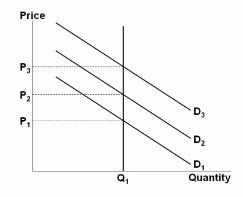
A. increase both the price level and the quantity of output produced.
B. increase output but leave prices unchanged.
C. lower the price level but leave output unchanged.
D. raise the price level but leave output unchanged.