Solve.The data set represents a bimonthly progression of gasoline prices over the course of several months in an unspecified city. Use a graphing calculator to determine the quadratic regression equation for this data set. 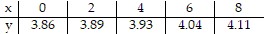
A. y = 0.00268x2 - 0.01107x + 3.85743
B. y = 0.01071x2 + 0.02214x - 3.85743
C. y = 0.01071x2 + 0.02214x + 3.85743
D. y = 0.00268x2 + 0.01107x + 3.85743
Answer: D
Mathematics
You might also like to view...
Find y '.y = 

A. -  - 6x
- 6x
B.  + 6x
+ 6x
C.  + 6x
+ 6x
D. -  + 6x
+ 6x
Mathematics
Solve.If a car salesperson who receives 15% commission received $2348.25 for selling a car, what was the cost of the car?
Fill in the blank(s) with the appropriate word(s).
Mathematics
Decide whether the given set of numbers is a commutative group under the given operation.Even integers; multiplication
A. Yes B. No
Mathematics
Find the standard deviation. Round to one more place than the data.73, 88, 36, 42, 41, 83, 55, 65, 63
A. 20.0 B. 18.7 C. 17.6 D. 7.6
Mathematics