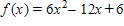
Use a graphing utility to graph the function and visually determine the intervals over which the function is increasing, decreasing, or constant.
?
?
A. ?increasing on (-?, ?)
B. descreasing on (-?, 1)increasing on (1, ?)
C. ?increasing on (-?, 1)descreasing on (1, ?)
D. ?descreasing on (-?, ?)
E. descreasing on (1, 1)increasing on (1, ?)
Answer: B
You might also like to view...
Solve the problem.Find the volume of the solid generated by revolving the region in the first quadrant bounded by the x-axis and the curve y = x cos x, 0 ? x ? ?/2 about the y-axis.
A.  - 8?
- 8?
B.  - 4?
- 4?
C.  + 2?2 - 4?
D.  - 4?
- 4?
What is the mode of this set of data: 12, 12, 20, 20, 52, 52, 48, 48?
A. 40 B. 12,20,52, and 48 C. 0 D. none
Simplify.4[1 + 5(22)]
A. 1936 B. 404 C. 484 D. 84
Suppose ? is an angle in standard position. Given an equation of the terminal side of ?, give the exact value of the indicated trigonometric function(s). Rationalize denominators if necessary.7x + 4y = 0, Quadrant IIFind 
A. 
B. 
C. - 
D. 