Figure 7-8
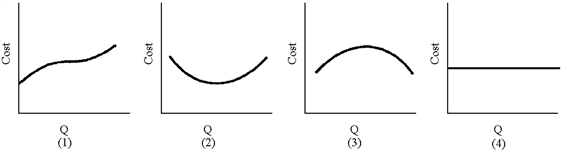
Of the graphs in Figure 7-8, which represents total cost?
a.
1
b.
2
c.
3
d.
4
a
Economics
You might also like to view...
Stadiums and arenas built for use by professional sports teams are often paid for by local governments using tax dollars
What kind of goods are these stadiums and arenas, and why would government use tax dollars to pay for them when the professional sports franchises that use them are generally quite successful, financially?
Economics
The ratio of equity to total assets is a measure of a bank's __________ risk
A) credit B) leverage C) interest rate D) liquidity
Economics
When supply is more elastic than demand, the buyer pays _____ of a tax.
A. all B. most C. half D. less than half
Economics
Explain the rational expectations hypothesis.
What will be an ideal response?
Economics