Solve the problem.A study was conducted to compare the average time spent in the lab each week versus course grade for computer students. The results are recorded in the table below. By using linear regression, the following function is obtained:  where x is the number of hours spent in the lab and y is grade on the test. Use this function to predict the grade of a student who spends 18 hours in the lab. Number of hours spent in lab Grade (percent) 10 96 11 51 16 62 9 58 7 89 15 81 16 46 10 51
A. 58.7
B. 55.1
C. 70.6
D. 51.1
Answer: B
Mathematics
You might also like to view...
Plot the graph of the regression line for the following table of values. x 1.38 3.5 4.75 6.23 y 7.14 11.23 13.78 17.39
What will be an ideal response?
Mathematics
Solve the problem.Evaluate  by integrating
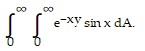
A. 
B. 
C. 
D. 
Mathematics
Fill in the blank.The opposite of -24 =  .
.
A. 
B. 24
C. -24
D. 0
Mathematics
Solve the inequality graphically. Express the solution in set-builder notation.12x - 12 > 3(3x - 10)
A. { x < 12}
B. { x > -6}
C. { x > 12}
D. { x < -6}
Mathematics