For each data set shown by the table, a. Create a scatter plot for the data.b. Use the scatter plot to determine whether an exponential function, a logarithmic function, or a linear function is the best choice for modeling the data.Percentage of Population Living in the South Suburbs of a Large City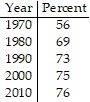

What will be an ideal response?
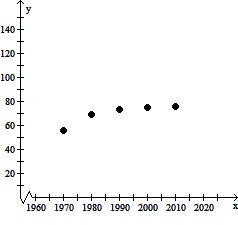
Logarithmic Function
Mathematics
You might also like to view...
Solve the problem.The northern third of Indiana is a rectangle measuring 96 miles by 132 miles. Thus, let 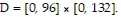 Assuming that the total annual snowfall (in inches), S(x,y), at
  is given by the function S(x,y) = 60e-0.001(2x + y) with (x,y) ? D, find the average snowfall on D.
A. 51.78 inches B. 52.06 inches C. 51.14 inches D. 52.44 inches
Mathematics
Solve the polynomial inequality.(x + 2)(x - 2)2 > 0
A. (-2, -2) ? (-2, ?) B. (-2, 2) ? (2, ?) C. (-2, ?) D. (-?, ?)
Mathematics
Determine if the data in the table are linear or nonlinear.
A. linear B. nonlinear
Mathematics
Solve the inequality. ? x + 1 or
  - 1 >
- 1 > 
A. (-?, -4) ? (12, ?) B. (-?, -4] ? [12, ?) C. (-?, 6] ? [12, ?) D. [12, ?)
Mathematics