The line graph shows the recorded hourly temperatures in degrees Fahrenheit at an airport. Use the graph to answer the question.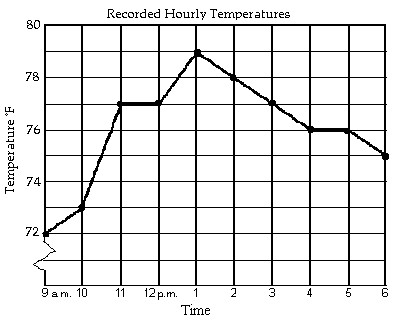 At what time was the temperature 72°?
A. 10 a.m.
B. 9 a.m. and 10 a.m.
C. 6 p.m.
D. 9 a.m.
Answer: D
You might also like to view...
Use a graphing calculator or computer to determine which of the given viewing windows displays the most appropriate graph of the specified function.f(x) = x4 - 9x2 + 5x
A. [-5, 5] by [-10, 15] B. [-10, 15] by [-5, 5] C. [-5, 5] by [-25, 15] D. [-25, 15] by [-5, 5]
Use the formula f'(x) = 
 to find the derivative of the function.f(x) = 2x2 + 3x + 5
A. 4x B. 2x + 3 C. 4x2 + 3x D. 4x + 3
Find the total surface area of the given space figure.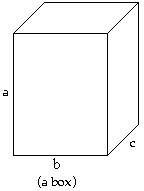 a = 19.1 cm, b = 11.9 cm, c = 18.5 cm.
A. 1381 cm2 B. 1602 cm2 C. 801 cm2 D. 1349 cm2
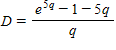
The average delay time D, in seconds, for a car waiting at a certain stop sign is given by
 ,
?
where q is the number of cars per second passing the stop sign.A: What is the average delay time if there are 0.13 cars per second passing the sign? Round your answer to two decimal places if necessary.B: The service rate S, for a stop sign is the number of cars per second that can leave the stop sign. It is related to the delay time by
,
?
where q is the number of cars per second passing the stop sign.A: What is the average delay time if there are 0.13 cars per second passing the sign? Round your answer to two decimal places if necessary.B: The service rate S, for a stop sign is the number of cars per second that can leave the stop sign. It is related to the delay time by
 .
Find a formula for S in terms of q.C: What flow rate will permit a service rate of 0.85 cars per second? Round your answer to two decimal places if necessary.
?
What will be an ideal response?
.
Find a formula for S in terms of q.C: What flow rate will permit a service rate of 0.85 cars per second? Round your answer to two decimal places if necessary.
?
What will be an ideal response?