Graph the function.Use the graph of f(x) = 3x to obtain the graph of g(x) = -3x.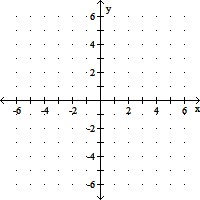
A. 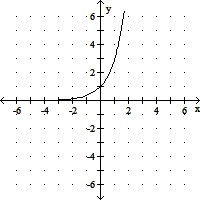
B. 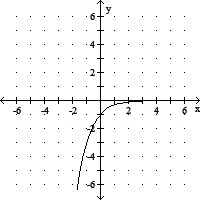
C. 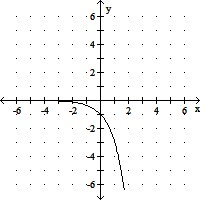
D. 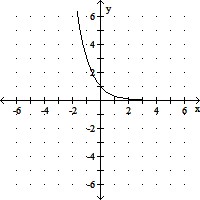
Answer: C
You might also like to view...
Graph the function, showing all asymptotes (those that do not correspond to an axis) as dashed lines. List the x- and y-intercepts.f(x) = 
A. x-intercept: (0, 0) , y-intercept: (0, 0) ;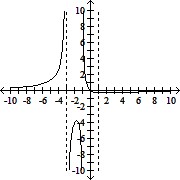
B. x-intercept: (0, 0) , y-intercept: (0, 0) ;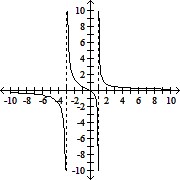
C. x-intercept: (0, 0) , y-intercept: (0, 0) ;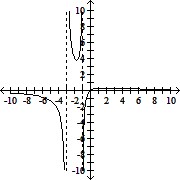
D. x-intercept: (0, 0) , y-intercept: (0, 0) ;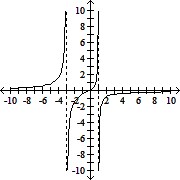
Find the horizontal and vertical components of the vector shown in the given figure.The magnitude of the vector is 34.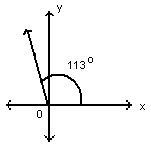
A. 13.3, -31.3 B. -31.3, 13.3 C. -13.3, 31.3 D. 31.3, -13.3
Find the area of the region specified in polar coordinates.one petal of the rose curve r = 4 sin 2?
A. 8?
B. 2?
C.  ?
?
D. 4?
Solve the problem.The inequality |T - 35| ? 18 describes the range of monthly average temperatures T in degrees Fahrenheit at a City X. (i) Solve the inequality. (ii) If the high and low monthly average temperatures satisfy equality, interpret the inequality.
A. 14 ? T ? 56; The monthly averages are always within 
B. T ? 53; The monthly averages are always less than or equal to 
C. 17 ? T ? 53; The monthly averages are always within 
D. 14 ? T; The monthly averages are always greater than or equal to 