Use the line graph to answer the question.Beginning with 1984, Lisa purchased a car every four years. The line graph illustrates the average fuel mileage in miles per gallon for each car. Between which two consecutive purchases did the greatest increase occur?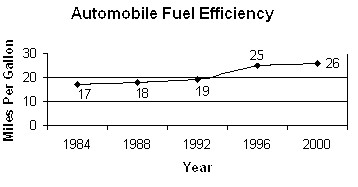
A. It is not possible to answer this question using the line graph.
B. 1984 to 1988
C. 1992 to 1996
D. 1996 to 2000
Answer: C
You might also like to view...
Evaluate the expression, given x = -2, y = 3, and a = -4.(-5 + x)(7 + y)(9 - a)
A. 910 B. -150 C. -910 D. -350
Evaluate the derivative at the given value of x.y = - ; x = -11
A. 
B. 
C. 
D. 
Make the indicated temperature conversion. Round answers to one decimal place if necessary.A weather forecaster has predicted a high temperature of 38°C for tomorrow. Convert this temperature to degrees Fahrenheit.
A. 10.9°F B. 100.4°F C. 53.1°F D. 36.4°F
Provide an appropriate response.Which of the following credit score classifications have an adverse affect on renters insurance premiums? I. good II. occasional payments past 30 days III. judgments, collection, bankruptcy
A. both II and III B. I only C. II only D. III only