The figure below represents the effects in the labor markets due to migration. Here, the world has been divided into a high-income "North" (left panel) and a low-income "South" (right panel). Dn and Sn are the labor demand and the labor supply curves in North. Ds and (Sr + Smig) are the labor demand and pre-migration labor supply curves in South. Sr is the post-migration labor supply curve in South. The value c is the cost of migrating.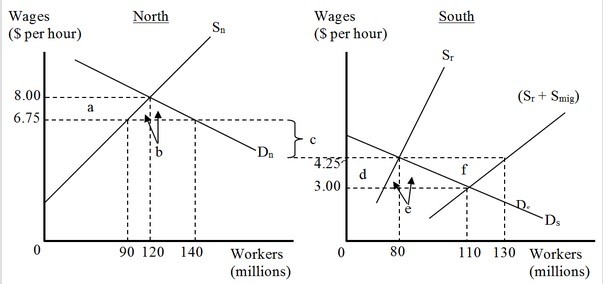 When migration is not allowed, workers in North earn ________ per hour and workers in South earn ________ per hour.
A. $8.00; $3.00
B. $8.00; $4.25
C. $6.75; $3.00
D. $6.75; $4.25
Answer: A
Economics
You might also like to view...
Spot market is to futures market as
A) rice is to beans. B) today is to tomorrow. C) squares are to circles. D) quarters are to dollars.
Economics
Refer to Table 2.3. Assume that 2010 is the base year. Real GDP in 2010 is
A) $490.00. B) $580.00. C) $671.00. D) $812.00.
Economics
An indifference curve is:
a. downward sloping and concave to the origin. b. downward sloping and convex to the origin. c. upward sloping and concave to the origin. d. upward sloping and convex to the origin.
Economics
The average variable cost curve and the average total cost curves are intersected at their __________ by the marginal cost curve.
Fill in the blank(s) with the appropriate word(s).
Economics