This graph demonstrates the domestic demand and supply for a good, as well as a tariff and the world price for that good.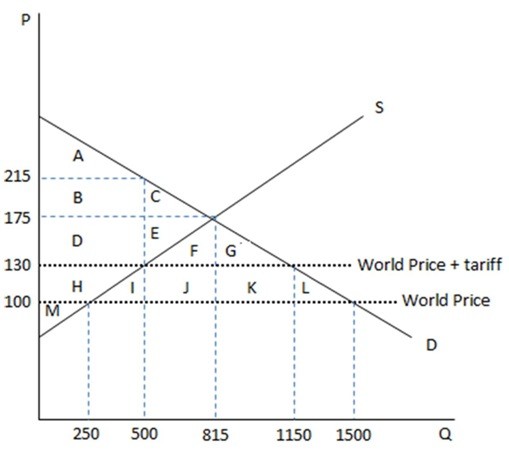 According to the graph shown, if this economy were to open to free trade, the domestic quantity demanded would be:
A. 1500.
B. 250.
C. 500.
D. 1150.
Answer: A
You might also like to view...
The real business cycle model suggests that, with aggregate demand unchanged, increases in output would be associated with ________
A) an increase in inflation B) a decline in inflation C) and unchanged price level D) procyclical inflation
Between 1960 and 2013 U.S. GDP, measured in dollars of constant purchasing power, expanded about 5.0 times. However, the standard of living only increased by 4 times over this period. Explain the difference
You are the Minister of Trade for a small island country with the following annual PPC: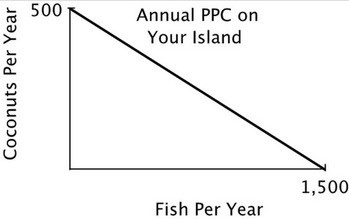 You are negotiating a trade agreement with a neighboring island with the following annual PPC:
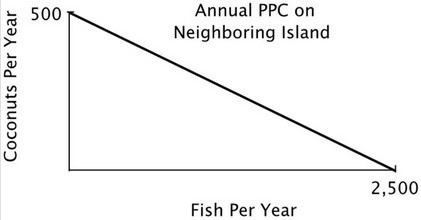 If the other island's delegate offers to give you 2 fish for every 1 coconut you give them, you will:
A. accept their offer because you do not have the comparative advantage in fish. B. refuse their offer because the opportunity cost to you of a coconut is less than 2 fish. C. refuse their offer because the opportunity cost to you of a coconut is more than 2 fish. D. accept their offer because you do not have an absolute advantage in fish.
What decade is considered pivotal in the passage of labor reform laws in the United States?
a. 1860s b. 1900s c. 1930s d. 1980s