The graph below shows the percentage of students enrolled in the College of Engineering at State University. Use the graph to answer the question. 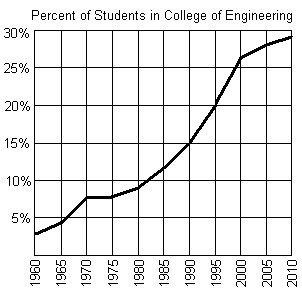 Between what two years is the difference in function values equal to 5%?
A. between 1980 and 1985
B. between 1970 and 1975
C. between 1990 and 1995
D. between 1995 and 2000
Answer: C
Mathematics
You might also like to view...
Estimate the magnitude of the error involved in using the sum of the first four terms to approximate the sum of the entire series.
A.  < 4.12 × 10⁻³
B.  < 1.23 × 10⁻²
C.  <
< 
D.  < 1.37 × 10⁻³
Mathematics
Round to the given value. $0.9984 cent
cent
A. $0.00 B. $1.01 C. $0.10 D. $1.00
Mathematics
Suppose you have the following project digraph. (The numbers in parentheses represent hours.)
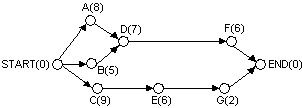 The length of the critical path from E is
A. 6 hours. B. 2 hours. C. 9 hours. D. 8 hours. E. none of these
Mathematics
Solve the problem.Alex has saved $770 at the bank. He wants to accumulate $1750 for a trip to soccer camp. What percent of his goal has been reached?
A. 44% B. 0.44% C. 20% D. 2%
Mathematics