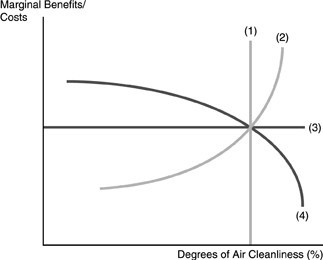
 Refer to the above figure. Suppose the marginal benefit and the marginal cost curves of pollution abatement are normally shaped. Technological change that made it easier to produce in a "cleaner" fashion would cause
A. curve (1) to shift out, increasing the optimal amount of pollution abatement.
B. curve (3) to shift up, raising the marginal benefits and costs and reducing the amount of pollution abatement.
C. curve (4) to shift out, increasing the optimal amount of pollution abatement.
D. curve (2) to shift out, increasing the optimal amount of pollution abatement.
Answer: D
You might also like to view...
If the structural deficit is $800 billion and the cyclical deficit is $600 billion, the actual budget deficit is
A) $200 billion. B) $800 billion. C) $1,400 billion. D) $600 billion. E) None of the above answers is correct.
If the "Marginal Congestion Cost" for a public good is constant then the optimal number of users is infinite
a. True b. False
Imagine that the best and the brightest professionals of the planet Venus migrate to Earth to work. The upside of this brain drain is
a. the remittances sent home to Venus b. getting rid of snooty Venetians c. not being able to afford the modern machinery that will help the Venetians become more productive d. decreased labor supply on Venus e. increased income inequality on Venus
The relationship between inputs and outputs is known as
A. marginal product. B. manufacturing. C. business. D. a production function.