In the graph, when disposable income is 3000, consumption
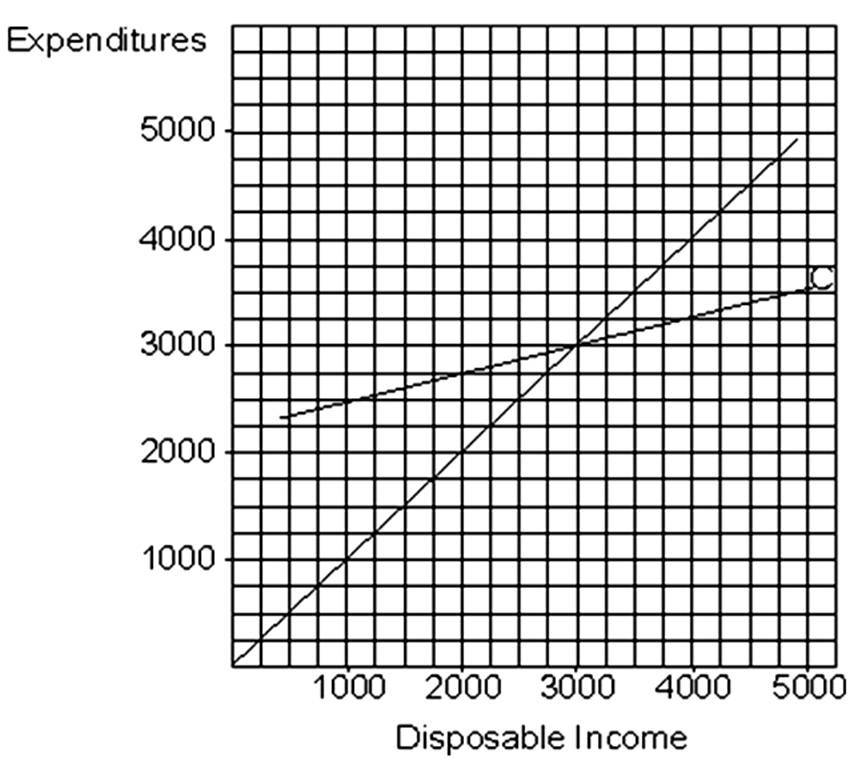
A. Is 2000.
B. Is 2500.
C. Is 3000.
D. Is 3500.
C. Is 3000.
You might also like to view...
Southern agriculture differed markedly from agriculture in the rest of the country before the Civil War in each of these respects EXCEPT
A. it had, on the average, larger farms. B. it had slavery. C. it had different major crops. D. it had more subsistence farming.
Based on the above table, if the current price level is 100 and the natural unemployment rate is 5 percent, what is the expected inflation rate?
A) 5 percent B) 2 percent C) 12 percent D) 8 percent E) 3 percent
If the economy is represented in the graph shown and is currently at point E3, what could be said about the state of the economy?
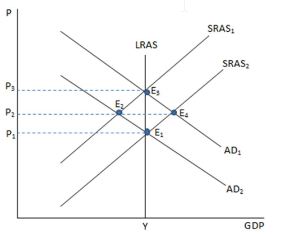
A. There is higher unemployment than the natural rate.
B. There is lower unemployment than the natural rate.
C. The unemployment rate is just about the natural rate.
D. The unemployment rate is zero.
You receive a 3 percent raise in your salary. The inflation rate is 4 percent. The purchasing power of your salary has
A. decreased by 11 percent. B. increased by 1 percent. C. increased by 11 percent. D. decreased by 1 percent.