Total U.S. government expenditures as a percentage of GDP were largest during which of the following periods of time?
A. The Great Depression
B. World War II
C. The Vietnam War
D. The Energy Crisis of the mid- and late-1970s
Answer: B
You might also like to view...
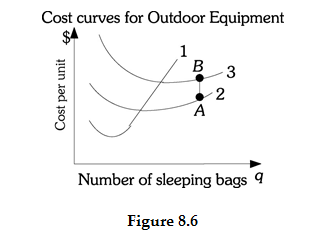
Refer to Figure 8.6. Curve 3 is Outdoor Equipment's A) marginal cost curve. B) average variable cost curve. C) average total cost curve. D) average fixed cost curve
If the government wants to encourage the consumption of a particular good, they should enact:
A. a subsidy to buyers, since they deserve the benefit more than the producers. B. a subsidy on either buyers or sellers, since they will both have the same effect on the market. C. a subsidy to buyers, since they want to affect consumption of the good. D. a subsidy to sellers, since they want more to be produced and offered for sale.
Refer to the figure below.________ inflation will eventually move the economy pictured in the diagram from short-run equilibrium at point ________ to long-run equilibrium at point ________, 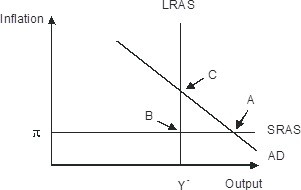
A. Rising; B; C B. Falling; A; C C. Falling; A; B D. Rising; A; C
The natural rate of interest is not
A) zero. B) the neutral rate of interest. C) Wicksellian rate of interest. D) associated with the natural rate of unemployment.