Use a graphing utility to graph the inequality.2x + y - 3 ? 0
A. 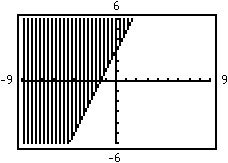
B. 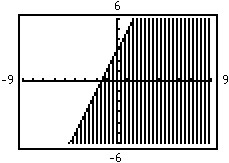
C. 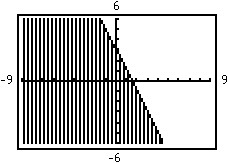
D. 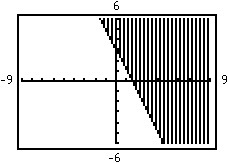
Answer: D
You might also like to view...
Solve the problem.The following graph indicates the hourly temperature in Riversbend, IL from 11 P.M. on March 6, 2008 to 7 A.M. on March 7, 2008. The function t(x) = -1.29x2 + 8.80x + 42.69 can be used to estimate the hourly temperature in Riversbend, where x is the number of hours after midnight. Use the graph to determine the hour that the temperature was a minimum.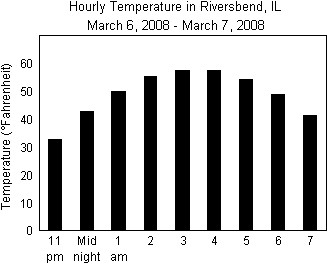
A. 4 A.M. B. 11 P.M. C. 3 A.M. D. 7 A.M.
Determine whether the function is one-to-one.f(x) = -1 - 7x
A. Yes B. No
Construct a bar graph of the given frequency distribution.The frequency distribution indicates the number of fish caught by each fisherman in a group of 250 fishermen.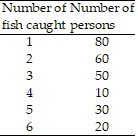
A. 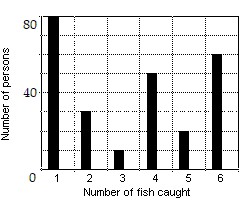
B. 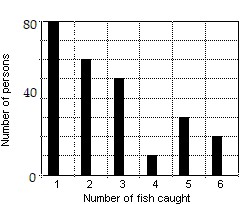
C. 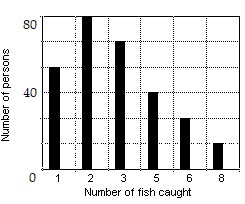
D. 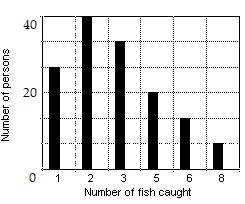
Solve the problem.A cell phone tower in a city transmits a signal in every direction from the tower. If the coverage area has a radius of 56 miles, what is the diameter of this coverage area?
A. 3136 mi B. 28 mi C. 560 mi D. 112 mi